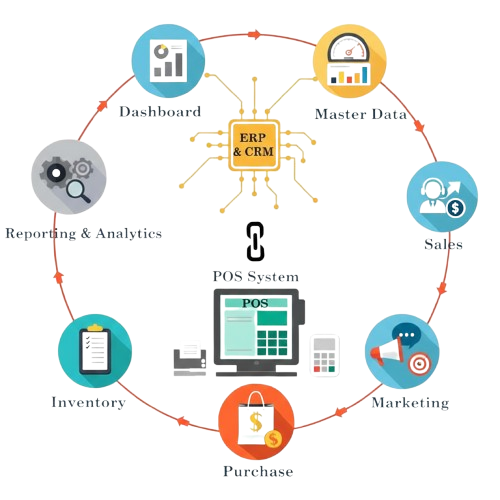
Access real-time data and reports from a single dashboard
Secure cloud access available across desktop, tablet, and mobile
Run your entire business online with clarity, speed, and control.
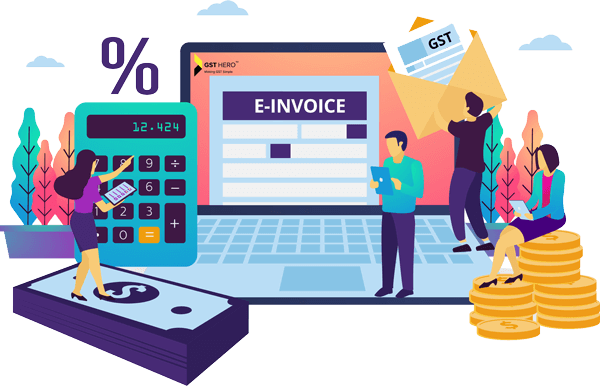
Manage Your GST Compliance with Ease
Our platform enables effortless
creation of e-Invoice bills, e-Way bills, and GST filing through official integration with
the GST portal.
Integrated with official e-Invoicing portal for
automated e-Invoice generation
Generate e-Invoices within 30 days of invoice date as
per government norms
Mandatory for businesses with turnover exceeding ₹5 Cr
since FY 2017-18
Generate e-Way Bills for goods worth over ₹50,000 –
optionally for lower values
File GST returns with details of sales, purchases, and tax
liabilities
Ensure full GST compliance through automated reports and
filings
Simplify your compliance journey
with our user-friendly dashboard, ensuring faster and smarter GST operations.
Experience the power of simplicity.
Ready to elevate your business to
new heights? Embrace the power of Run On Web today! Get started now.
Traders
Manufacturers
Wholesale Suppliers
Service Providers
Supermarkets
Mobile Shops
Petty Shops
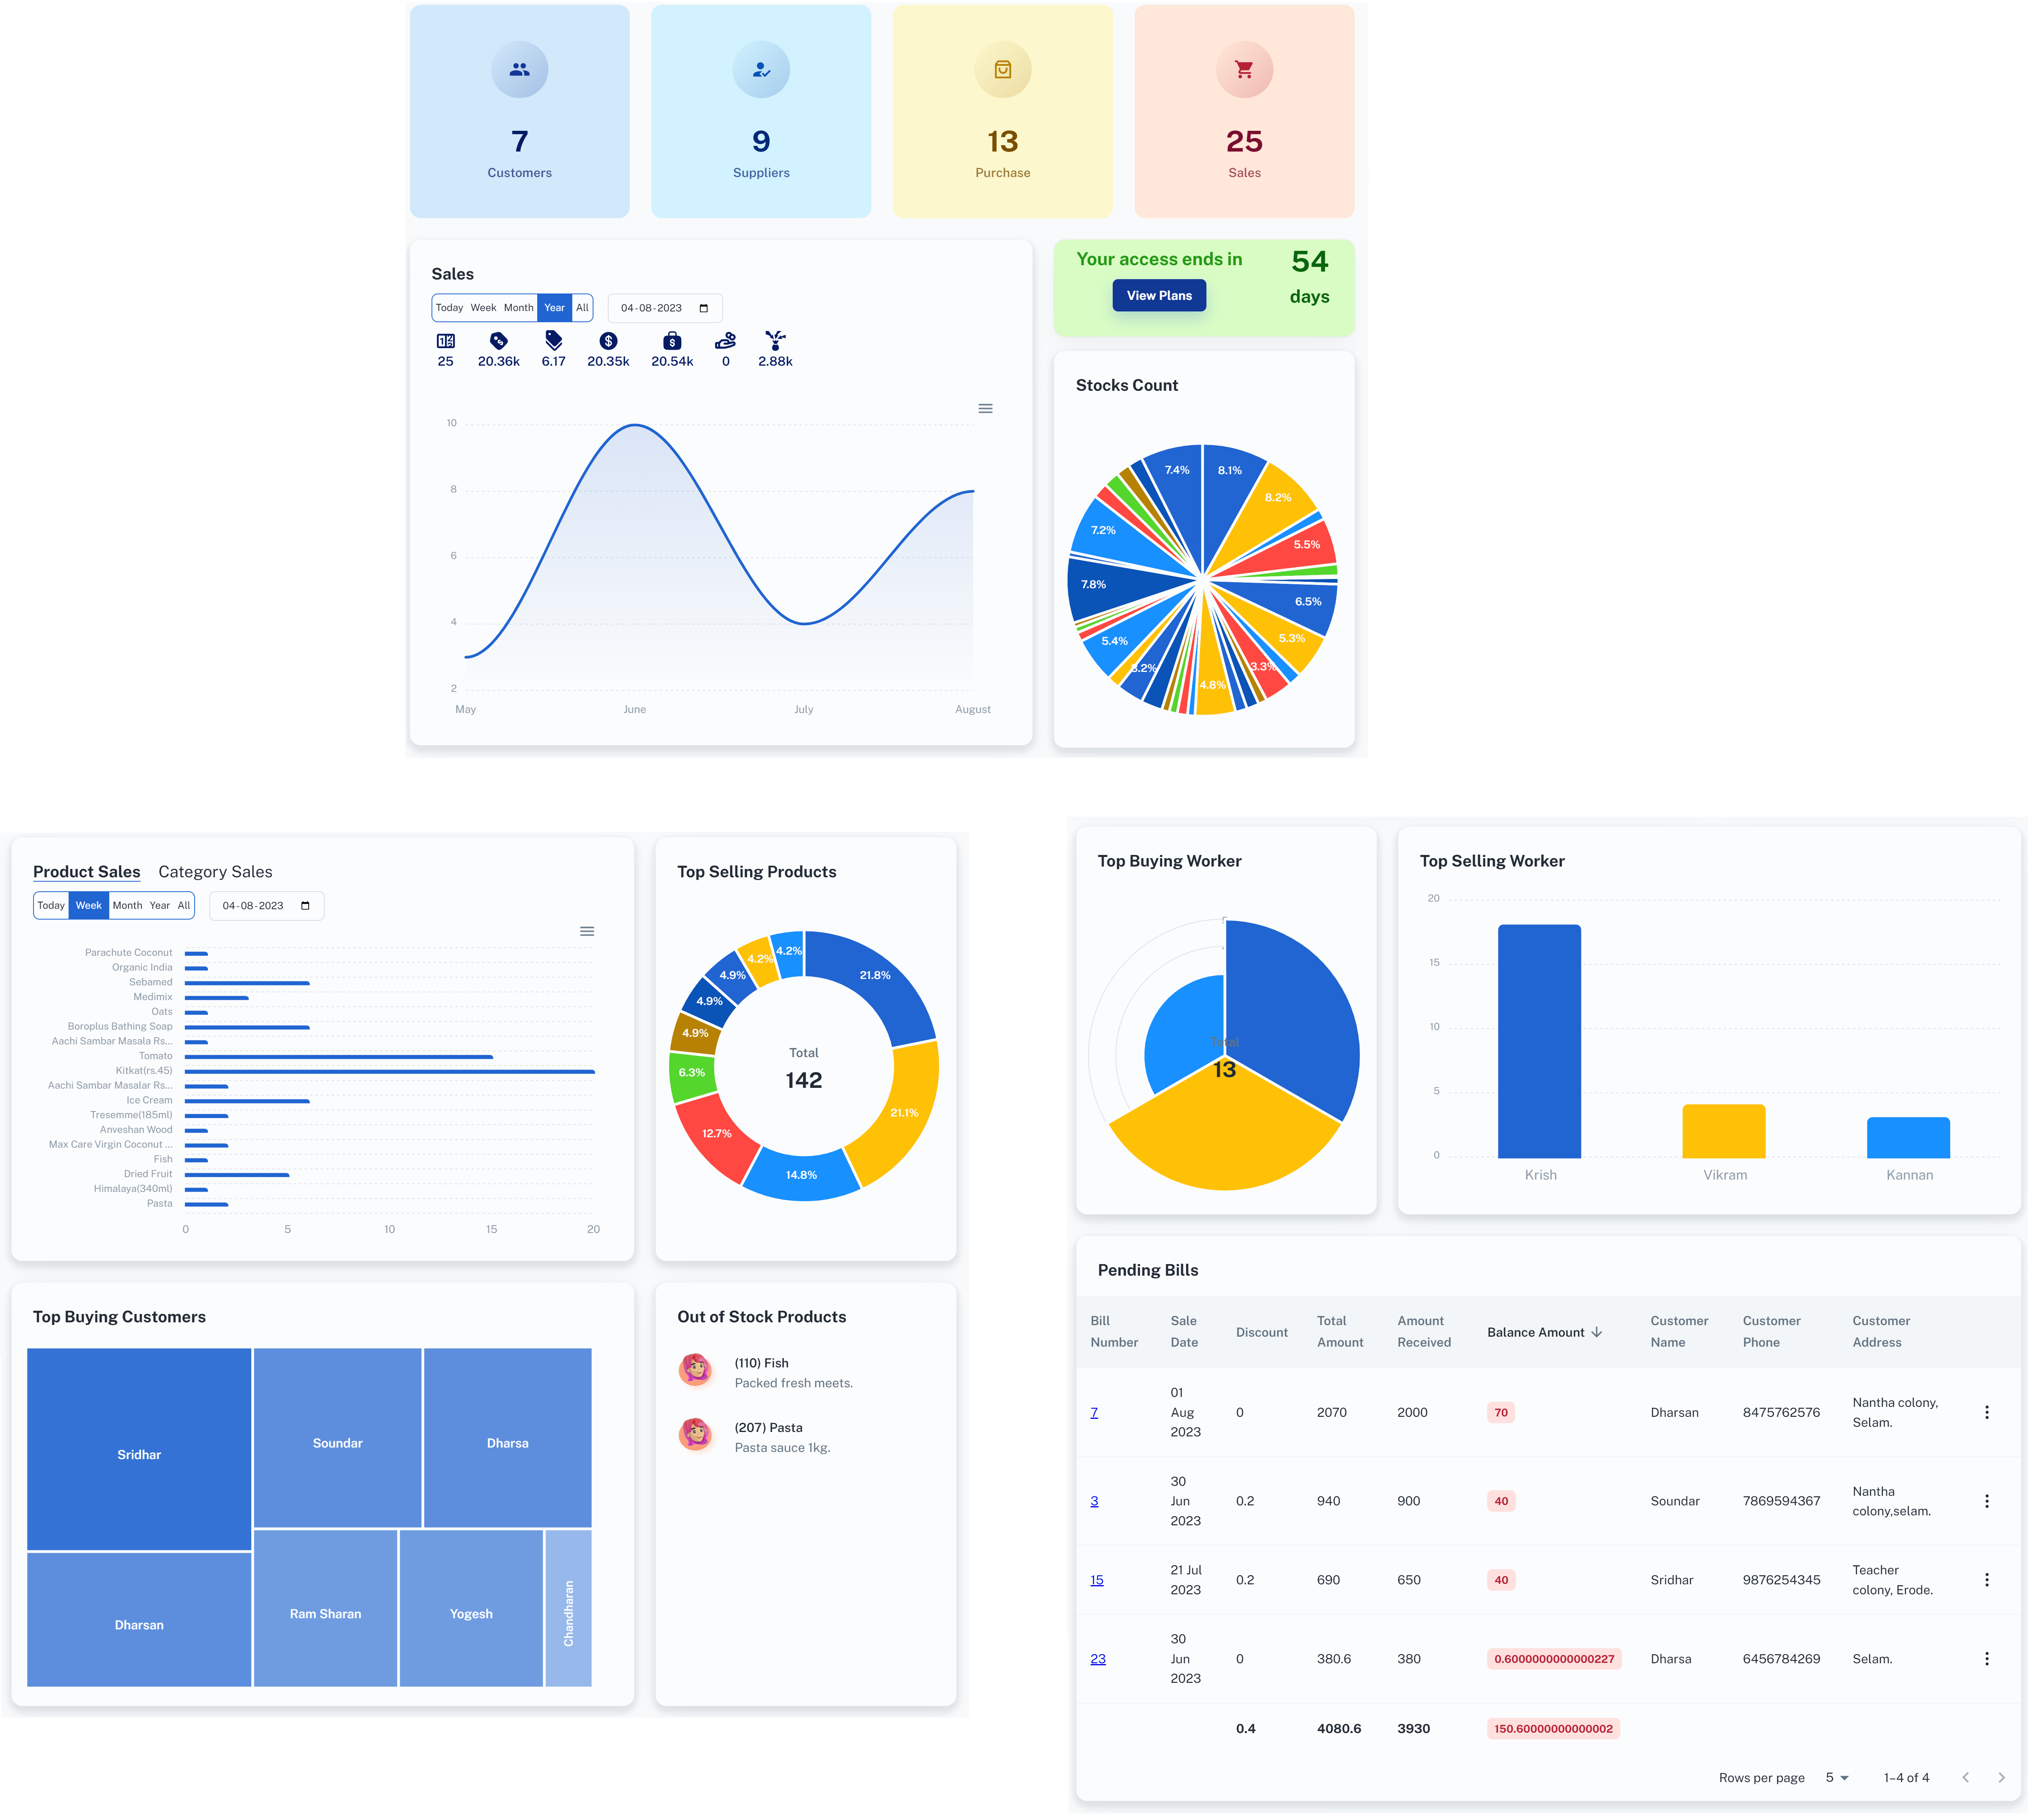
Revolutionize Our Dashboard Experience
Our dashboard provides you with
the key information you need to make informed decisions. Explore Run On Web today!
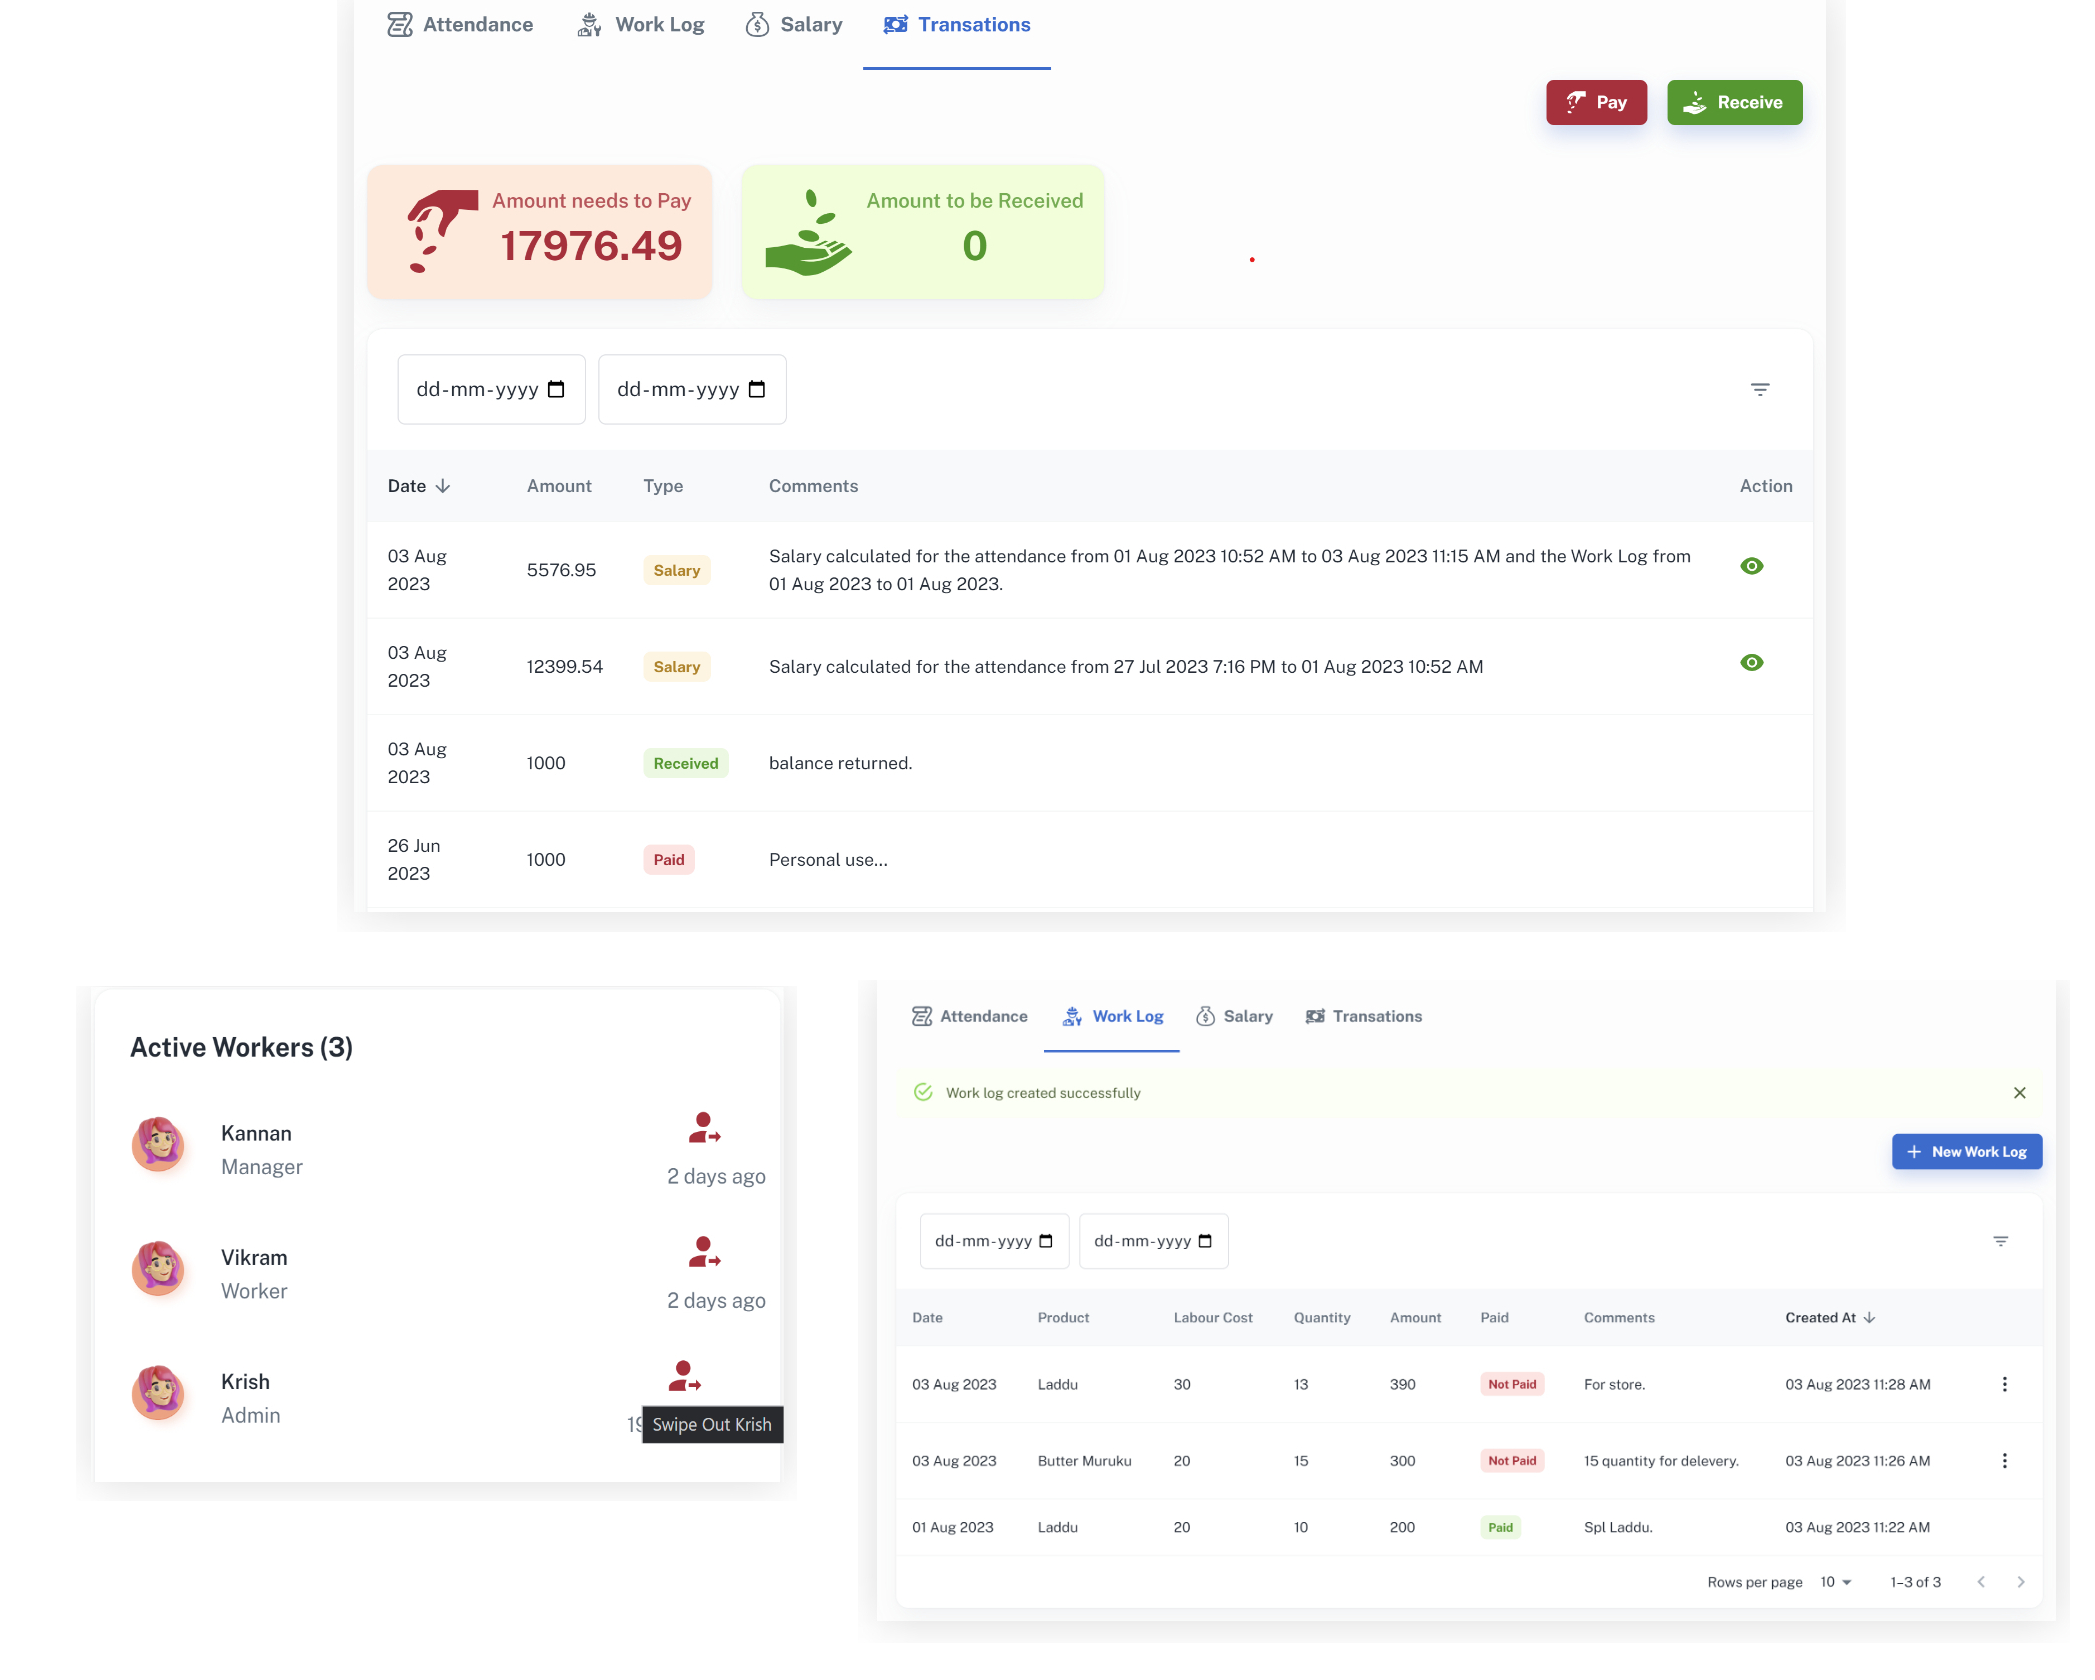
Track your sales, purchases and stocks & manage staffs
Analyze 14+ business reports and make strategic
decisions
Digitize your business operations & grow 2X
Digitize, organize and manage your business
properly
Enhance inventory management efficiency and reduce
manual efforts
Generate detailed salary slips for staff members with just a
few clicks
Manage cash flow efficiently
Our user-friendly
dashboard presents critical insights, empowering you to lead your business to new heights.
Stay Connected With Your Customers
Stay connected with your
customers effortlessly using Run on Web. Engage, communicate, and build stronger
relationships anytime, anywhere.
Engage customers seamlessly via email, SMS, and
WhatsApp.
Easily send promotional emails to your customers.
Strengthen relationships with effortless
communication tools.
Stay connected and expand your business, wherever you
are.
Build trust with real-time engagement.
Efficiently organize and manage customer data for better
insights.
Simplify communication with Run on Web
solution
Our user-friendly dashboard
presents critical insights, empowering you to lead your business to new heights.
"I'm
beyond impressed with Run On Web. The Run On Web revolutionized how I manage my business. From
staff management to inventory management, it's an all-in-one solution that has given me more
control and freedom."
Diwakar
CEO
at ejeeva
Pricing
Pay per use
Here at
Run On Web we focus on long-term value and drive economic growth.
Enter number of branches & number of employees and Select / Un Select the
features (green color checkbox) based on your business needs. Amount will be calculated as per the
features selected by you.
Run On Web empowers
businesses of all sizes to manage sales, purchases and stock & manage staff attendance,
worklog and salary. Generate professional invoices and efficiently handle financial
transactions.
Absolutely! Run On Web
is designed to businesses of all sizes and industries. Whether you are a small startup
or an established enterprise, Run On Web is tailored to meet your business needs.
Employees daily wages and production wages per unit are easily calculated in Run On
Web.
Manage sales, purchase, accounts, billing, timesheet and salary effectively.
Have customer & supplier information handy.
Provides a secure platform for SMB owners to record day-to-day transactions & track
business performance on the go.
Tracks & manages inventory using features like stock adjustment, low stock
reminders, etc.
100% safe & secure environment. All the transactions are encrypted and stored in
best-in-class secure cloud servers.
Yes, it does! Run On
Web automates tax calculations, allowing you to set up tax rates once and have them
applied to relevant invoices automatically.
Start your free trial today
Try Run
On Web Platform for 30 days. No credit card required.